

Excel Stats
1M +
Rows of Data
1-1.5 Bn
Users Worldwide
54%
of Businesses Use
The Power of Microsoft Excel
1. User-Friendly Interface
Excel is renowned for its user-friendly design that employs a grid system simplifying data management. The formula bar is prominently placed at the top of the window which facilitates the easy entry and manipulation of formulas—particularly beneficial for beginners grappling with complex calculations. It showcasses logical and navigable menus further to enhance the user experience by organizing an extensive range of functions, from basic formatting to advanced data analysis tools, eliminating the need for extensive training.
In addition the tooltips and context-sensitive help features actively assist users as they navigate through different functions and options, augmenting the overall learning experience. This proactive approach to user support enhances comprehension and encourages users to explore the diverse capabilities of the software, progressively building confidence.
The fluidity in workflow is another distinguishing feature of Excel’s interface, enabling users to effortlessly transition between tasks such as entering data, creating formulas, and generating visual representations like charts and graphs. This seamless transition not only boosts productivity but also solidifies Excel’s standing as an ideal choice for a spectrum of applications, ranging from simple budgeting to complex data analysis.

2. Versatility
Excel’s versatility lies in its capacity for efficient data management and calculations. Users can seamlessly input and organize data, enforcing structured consistency. Whether performing basic arithmetic or utilizing a comprehensive library of functions for complex formulas, Excel provides dynamic calculations and supports a range of statistical analyses.
In addition to data management, Excel excels in data visualization with customizable charts and graphs. Its PivotTables enable dynamic data summarization, complemented by PivotCharts for graphical insights. Furthermore, Excel facilitates data modeling and analysis through tools like Scenario Manager, Goal Seek, and Solver. Lastly, the platform offers automation capabilities with macros, utilizing Visual Basic for Applications (VBA) to streamline repetitive tasks. In essence, Excel’s versatility spans from fundamental data handling to advanced analytics and automation, making it indispensable across various tasks and industries.
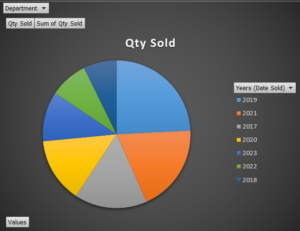
3. Data Visualization
Excel’s charting and graphing capabilities empower users to transform raw data into visually compelling representations, turning mundane numbers into meaningful insights. The application offers a diverse range of chart types, ensuring flexibility in illustrating various data patterns and trends.
One of Excel’s strengths lies in its user-friendly interface, making it accessible for both beginners and advanced users. Creating a chart is as simple as selecting the data range and choosing the desired chart type. Whether it’s a classic line chart for showcasing trends over time, a bar chart for comparing categories, or a pie chart for displaying proportions, Excel provides a plethora of options to suit different data visualization needs.
Beyond the basics, Excel’s advanced features come into play for users seeking more sophisticated visualizations. Pivot tables, for instance, allow dynamic rearrangement and summarization of data, offering a powerful tool for in-depth analysis. With just a few clicks, users can create intricate pivot charts that dynamically adjust as underlying data changes, ensuring up-to-date and accurate representations.
Excel also supports customization, enabling users to tailor visuals to match their specific requirements. From adjusting color schemes and fonts to adding labels and annotations, Excel provides a high degree of control over the appearance of charts and graphs. This not only enhances the aesthetics but also helps convey information more effectively.

4. Widespread Adoption
The widespread adoption of Excel transcends mere popularity, reflecting its fundamental role in enhancing efficiency, collaboration, and communication across diverse business environments. Its universal presence underscores its adaptability and utility, making it an indispensable asset for professionals and organizations navigating the complexities of the contemporary business landscape.
Microsoft Excel’s adaptability to evolving business needs contributes to its enduring relevance. From small startups to multinational corporations, the tool accommodates a spectrum of requirements, evolving alongside the dynamic nature of modern business practices. As industries continue to evolve, Excel remains a constant, adapting to new challenges and technologies, thereby sustaining its position as a fundamental tool in the professional toolkit.
The job roles and functions people perform using Excel are as varied as the industries they represent. Professionals across finance, marketing, human resources, operations, and more leverage Excel for tasks such as data analysis, financial modeling, project management, budgeting, and reporting. Its user-friendly interface and powerful features enable individuals to manipulate and interpret data, facilitating informed decision-making processes. Excel’s role extends beyond individual contributions, fostering collaboration among team members and enabling seamless communication across different departments and organizations. In essence, Excel serves as a linchpin, supporting a multitude of functions and roles critical to the success of businesses worldwide.
5. Integration with Other Tools
Excel’s seamless integration with other tools extends its functionality beyond mere spreadsheet management. This interoperability is a key strength that contributes to its widespread use in diverse business environments. Here are some aspects to consider when discussing Excel’s integration capabilities:
1. Microsoft Office Integration:
– PowerPoint: Excel integrates seamlessly with PowerPoint, allowing users to embed dynamic Excel charts and tables directly into PowerPoint presentations. This ensures that data in presentations is always up-to-date and linked to the original source in Excel.
– Word: Integration with Word enables users to import Excel data into Word documents. This is particularly useful when creating reports or documents that require numerical or tabular data from Excel spreadsheets.
2. Data Exchange:
– Import and Export Data: Excel supports a wide range of data import and export formats. This enables users to easily bring in data from external sources or export Excel data to be used in other applications. This flexibility is crucial for data analysis and reporting. Discover how to convert a PDF document into Excel by these quick steps easily.
3. Third-Party Tools:
– Database Integration: Excel can connect to various external databases, such as SQL Server, Access, and others. This is beneficial for businesses that store their data in databases, allowing for real-time data retrieval and analysis within Excel.
– Business Intelligence Tools: Integration with business intelligence tools like Power BI enhances Excel’s capabilities. Users can create sophisticated visualizations and dashboards in Power BI, and then embed or link them directly within Excel for a comprehensive data analysis experience.
4. Collaboration:
– SharePoint Integration: Excel integrates with Microsoft SharePoint, a collaboration platform, facilitating document sharing and version control. This ensures that multiple users can collaborate on Excel files simultaneously, enhancing teamwork and productivity.
– Microsoft Teams: With integration into Microsoft Teams, Excel becomes a collaborative space where team members can work together on spreadsheets in real-time, fostering efficient communication and collaboration.
5. Automation and Scripting:
– VBA (Visual Basic for Applications): Excel supports VBA, a programming language that allows users to automate tasks and create custom functions. This extends Excel’s capabilities beyond its standard features, making it a powerful tool for tailored data processing and analysis.
6. Cloud Integration:
– OneDrive and Microsoft 365: Excel seamlessly integrates with cloud services like OneDrive and Microsoft 365, allowing users to access their spreadsheets from anywhere and collaborate in real-time. This cloud integration ensures data consistency across devices and locations.
https://youtu.be/RHZpgLqKzbw?si=yyNCDNQfU3HSbReE
6. Educational Resources
In today’s digital age, the wealth of educational resources, tutorials, and online courses for Microsoft Excel has empowered users to continually enhance their skills. The abundance of knowledge available not only facilitates personal and professional growth but also contributes significantly to Excel’s sustained relevance in the dynamic landscape of data analytics.
If you’re looking to stay ahead in mastering Microsoft Excel and other powerful tools like Power BI, you’re in the right place! Subscribe to my YouTube Channel, SkillUpAndExcel, for exclusive access to free and resourceful content. Whether you’re a beginner aiming to grasp the fundamentals or an advanced user seeking to explore advanced features, my channel offers a diverse range of tutorials and insights.
Join our community of learners dedicated to Excel proficiency and data analytics excellence. The journey to skill enhancement is just a click away! Subscribe now and embark on the path to unlocking the full potential of Microsoft Excel and other essential tools in the world of data analysis. Let’s Skill Up And Excel together!”
7. Time-Saving Shortcuts
Excel offers numerous keyboard shortcuts that can significantly improve workflow efficiency. For example, pressing Ctrl + Shift + L quickly toggles Excel’s filter on and off, facilitating data exploration. Check out this Tutorial for more time-saving tips.
https://youtu.be/q59HPg6A0XI?si=DcN0ft9H-W9nZpxH
8. Excel for Beginners
For those new to Excel, there are plenty of beginner-friendly tutorials available that cover the basics and provides a solid foundation for more advanced data analysis.
https://youtu.be/KfSfrBYpMoc?si=G7L5VtrvawIKSxyx
Limitations of Microsoft Excel
Data Size Constraints:
One of the notable limitations of Excel is its restriction in handling large datasets. Excel workbooks are limited to a maximum of 1,048,576 rows per worksheet. This constraint can pose significant challenges for users dealing with extensive datasets, especially in fields like finance, research, or data science, where the volume of information may surpass Excel’s capacity. As a result, users may find themselves needing more robust tools and database management systems to efficiently handle and analyze substantial amounts of data beyond Excel’s capabilities.
Limited Processing Speed:
Excel’s processing speed can become a bottleneck when dealing with complex calculations or manipulating large datasets. The software may experience performance issues, particularly when executing intricate formulas or handling data-intensive operations. This limitation becomes particularly evident in scenarios where real-time analytics is crucial. Users relying on Excel for dynamic, fast-paced decision-making processes may encounter delays that hinder the overall efficiency of their analytical workflows. In such cases, alternative solutions with enhanced processing capabilities may be necessary for smoother and more responsive data processing.
Lack of Advanced Analytics Features:
While Excel is a versatile tool for basic data analysis and reporting, it falls short when it comes to handling advanced analytics tasks. Tasks requiring machine learning algorithms, predictive modeling, or complex statistical analyses are beyond the scope of Excel’s capabilities. As industries increasingly rely on sophisticated data-driven insights, Excel’s limitations become apparent. Professionals in fields like artificial intelligence, data science, and advanced analytics often turn to specialized tools and programming languages to perform intricate analyses that go beyond Excel’s capabilities. This limitation underscores the need for a more comprehensive and specialized approach to advanced data analytics beyond what Excel can offer.
Excel vs. Specialized Tools:
While Excel remains a powerful tool for certain analytics tasks, specialized tools have emerged to address the shortcomings of spreadsheet software. Business Intelligence (BI) tools like Tableau, Power BI, and Python-based libraries like Pandas have gained popularity for their ability to handle big data, perform advanced analytics, and create interactive dashboards.
Conclusion
In conclusion, Microsoft Excel is undoubtedly a formidable tool for data analytics, offering a range of functionalities in a user-friendly package. Its widespread adoption and ease of use make it an invaluable asset in various industries. However, the title of the “ultimate” data analytics tool may be better suited to specialized tools that excel in handling big data, advanced analytics, and complex modelling. The choice between Excel and other tools ultimately depends on the specific needs and complexity of the analytics tasks at hand.
As the field of data analytics continues to evolve, professionals may find themselves leveraging a combination of tools to harness the full potential of their data. The symbiotic relationship between traditional spreadsheet software and specialized analytics tools is shaping the future of data-driven decision-making, ensuring that professionals have a diverse toolkit to navigate the complexities of the data landscape.